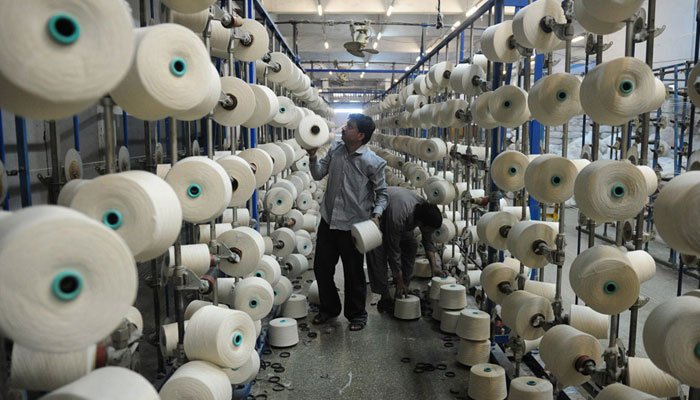
Latest PBS data paints grim picture of exports.
Pakistan’s textiles exports drop by 18.15% in November. Pakistan’s textiles exports dropped for the second consecutive month in November, dropping 18.15% to $1.42 billion from $1.736 billion in the corresponding month last year, the Pakistan Bureau of Statistics (PBS) said.
According to the latest data, exports of components like cotton cloth, knitwear, bedwear, and towels shrunk while readymade garments exports remained unchanged from the last year.
The PBS said, compared with the previous month, Pakistan’s exports were up 4.7% over November 2021’s exports of $1.357 billion.
The textile sector’s total exports were down 5.1% from July to November, to $7.36 billion from $7.76 billion during the same period last year.
Cotton cloth exports dipped by 25% to $153.7 million in November 2022 compared to $204.85 million in November 2021, while exports decreased by 9.45% over the previous month’s exports of $169.6 million.
However, compared to October, knitwear exports surged 2.17% to $400.2 million, bedwear 2.45% to $222.5 million, towels exports spiked 16.4% to $92.65 million, while exports of readymade garments increased 18.55% to $326.7 million.
More From FactFile: Pakistan’s exports move up by 35.7% in fist four months of fiscal year 2022-23
Likewise, over the corresponding month of last year, knitwear exports declined 12.8%, bedwear exports slashed 29.4%, and towels sales abroad went down 12%, while readymade garments exports were the same as recorded in November 2021.
Textile sector is Pakistan’s top exporter, occupying over 60% of the country’s total exports. In FY22, total textile exports were at a record high of $19.35 billion, with an increase of over a quarter over FY21’s exports of $15.4 billion.
Food group exports increased 4.6% to $434.3 million against $415.3 million recorded in October 2022 and 15.6% decline on YoY basis, when this group’s exports were at $514.7 million. Rice exports were $203.15 million against $143.8 million in the previous month and $231.9 million in November 2021. On MoM basis, rice exports in November 2022 increased by over 41%, while compared to the same month of last year exports declined by 12.4%.
Imports
In November 2022, petroleum group imports increased 38.56% to $1.646 billion against $1.19 billion in October 2022. Its imports declined 24.6% over $2.18 billion imported in the same month last year.
Over the previous month, imports of petroleum products increased 55.5% to $708.2 million, crude 46.64% to $546 million, LNG 7.16% to $318 million, and LPG imports went up 16.1% to $73.8 million. Over November 2021, petroleum products imports decreased by 43.8% and LNG imports went down 23.9%; however, crude imports rose 25.2% and LPG10.2 %.
Metal group (including gold, iron, and others) imports were slashed by 8.15 % to $364.1 million compared to the previous month’s imports of $396.4 million. Over November 2021, imports were of $663.4 million, depicting a decline of 45.1%. Of this, over the previous month, gold imports were down 11% to $2.2 million, iron and steel scrap down 5.9 % to 111 million, and iron and steel fell by 12% to $153.7 million. Over the corresponding month of last year, gold imports were down 31.8%, iron and steel scrap down 59.6%, and iron and steel imports were down by 44.6 %.
In November 2022, the economy imported 17% more machinery and it stood at $535 million against $457 million in the previous month of October. In November 2021, machinery imports were $1.1 billion, depicting a decline of 49.9%.
Over the corresponding month of last year, textiles machinery imports declined 60.6% to $25 million, power generation machinery went down 64.6% to $57.7 million, and telecom sector machinery imports fell by 61.2% to $110.1 million, electrical machinery imports by 15.45% to $156 million and construction and mining machinery imports declined 73.6% to $4.78 million.


Thank you very much for sharing, I learned a lot from your article. Very cool. Thanks.